
Description
Package to generate Chart.js charts directly from Laravel/Blade, without interacting with JavaScript.
Simple Usage
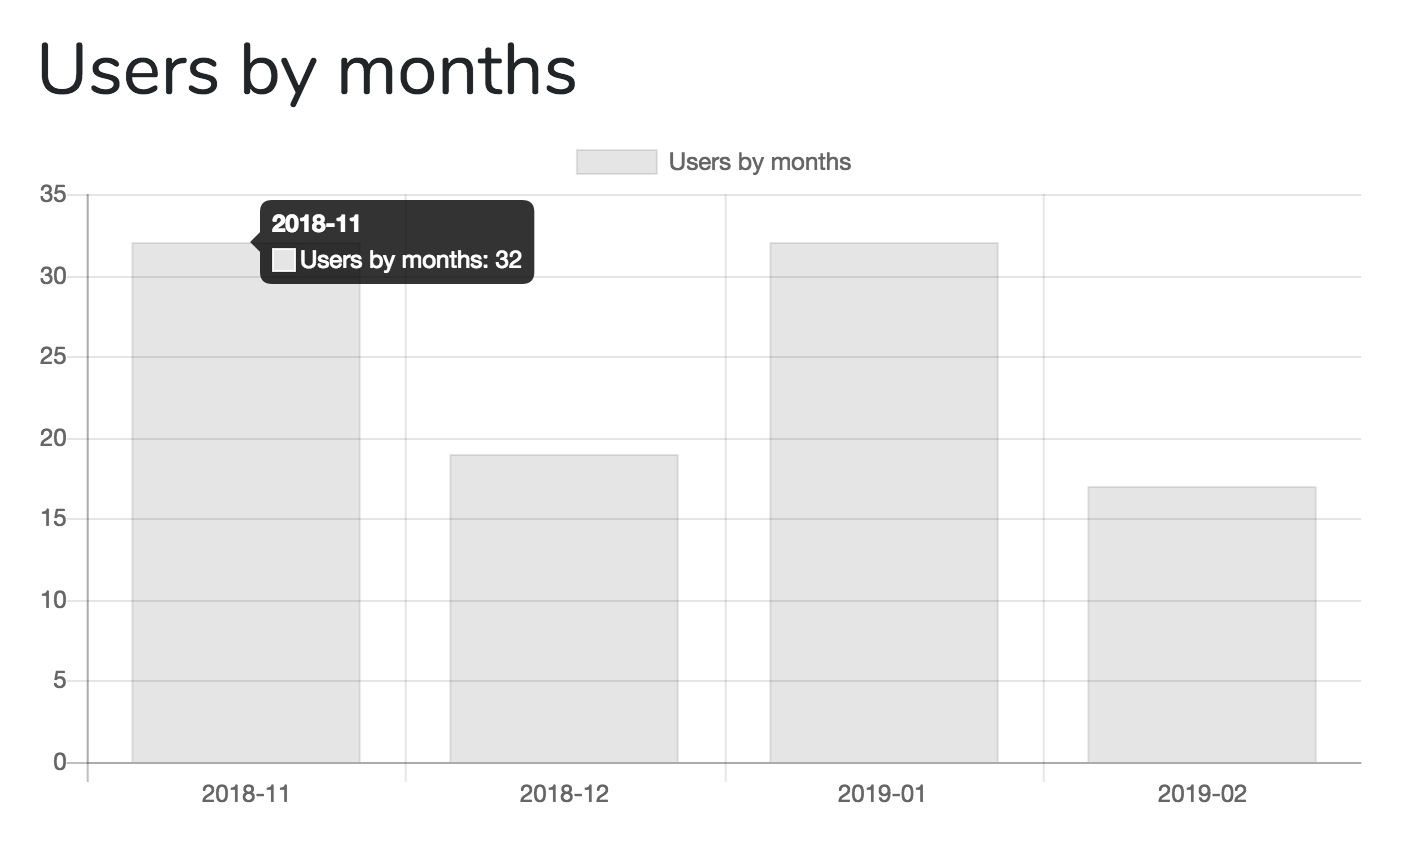
If you want to generate a chart above, grouping users records by the month of created_at value, here's the code.
Controller:
use LaravelDaily\LaravelCharts\Classes\LaravelChart; // ... $chart_options = [ 'chart_title' => 'Users by months', 'report_type' => 'group_by_date', 'model' => 'App\Models\User', 'group_by_field' => 'created_at', 'group_by_period' => 'month', 'chart_type' => 'bar',];$chart1 = new LaravelChart($chart_options); return view('home', compact('chart1'));View File
@extends('layouts.app') @section('content')<div class="container"> <div class="row justify-content-center"> <div class="col-md-8"> <div class="card"> <div class="card-header">Dashboard</div> <div class="card-body"> <h1>{{ $chart1->options['chart_title'] }}</h1> {!! $chart1->renderHtml() !!} </div> </div> </div> </div></div>@endsection @section('javascript') {!! $chart1->renderChartJsLibrary() !!} {!! $chart1->renderJs() !!}@endsectionRecent Courses on Laravel Daily
AI Agents/IDEs for Laravel: May 2026 (Claude Code, Codex, OpenCode, etc)
7 lessons
52 min
Laravel 13 Starter Kit Teams and Customizations
10 lessons
33 min
Roles and Permissions in Laravel 13
14 lessons
57 min