
In the admin panel dashboards, you may show some statistics data, but maybe you want to add date filters there? So in this quick tutorial, I will show you how to add a filter to Filament widgets.
It's done differently for two types of widgets: Table and Chart. Let's look at them separately.
Filter Widgets Table
First, to show records in the table, Filament uses its package filament/tables. That means in the table widget we can use all features of the filament/tables.
First, we need to create a widget.
php artisan make:filament-widget LatestTasks --tableThen, following the docs, we need to add two methods:
-
getTableQuery()which will return the data -
getTableColumns()to define which columns to show in the table.
Also, I will add the $columnSpan property to show the table in full width.
app/Filament/Widgets/LatestTasks.php:
use App\Models\Task;use Filament\Tables\Filters\Filter;use Filament\Tables\Columns\TextColumn; class LatestTasks extends BaseWidget{ protected int | string | array $columnSpan = 'full'; protected function getTableQuery(): Builder { return Task::query()->latest(); } protected function getTableColumns(): array { return [ TextColumn::make('title') ->searchable() ->sortable(), TextColumn::make('created_at') ->dateTime(), ]; }}Now, as I said, this is just a basic Filament table, so using the docs, we can add the getTableFilters() method to add filters to it.
app/Filament/Widgets/LatestTasks.php:
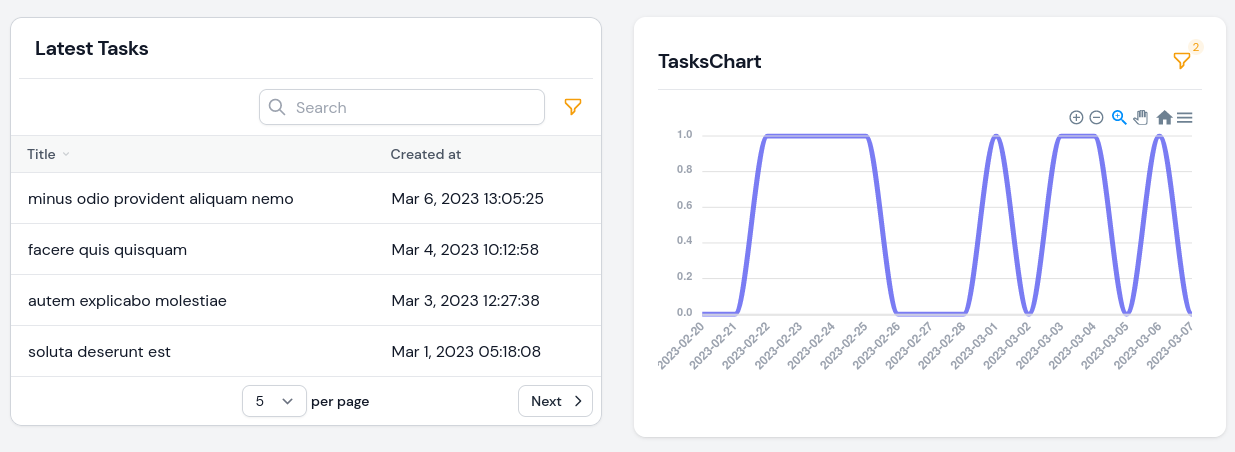
use Filament\Forms\Components\DatePicker;use Illuminate\Database\Eloquent\Builder; class LatestTasks extends BaseWidget{ protected int | string | array $columnSpan = 'full'; protected function getTableQuery(): Builder { return Task::query()->latest(); } protected function getTableColumns(): array { return [ TextColumn::make('title') ->searchable() ->sortable(), TextColumn::make('created_at') ->dateTime(), ]; } protected function getTableFilters(): array { return [ Filter::make('created_at') ->form([ DatePicker::make('created_from'), DatePicker::make('created_until'), ]) ->query(function (Builder $query, array $data): Builder { return $query ->when( $data['created_from'], fn(Builder $query, $date): Builder => $query->whereDate('created_at', '>=', $date), ) ->when( $data['created_until'], fn(Builder $query, $date): Builder => $query->whereDate('created_at', '<=', $date), ); }) ]; } }After this, your table widget will have a date filter:
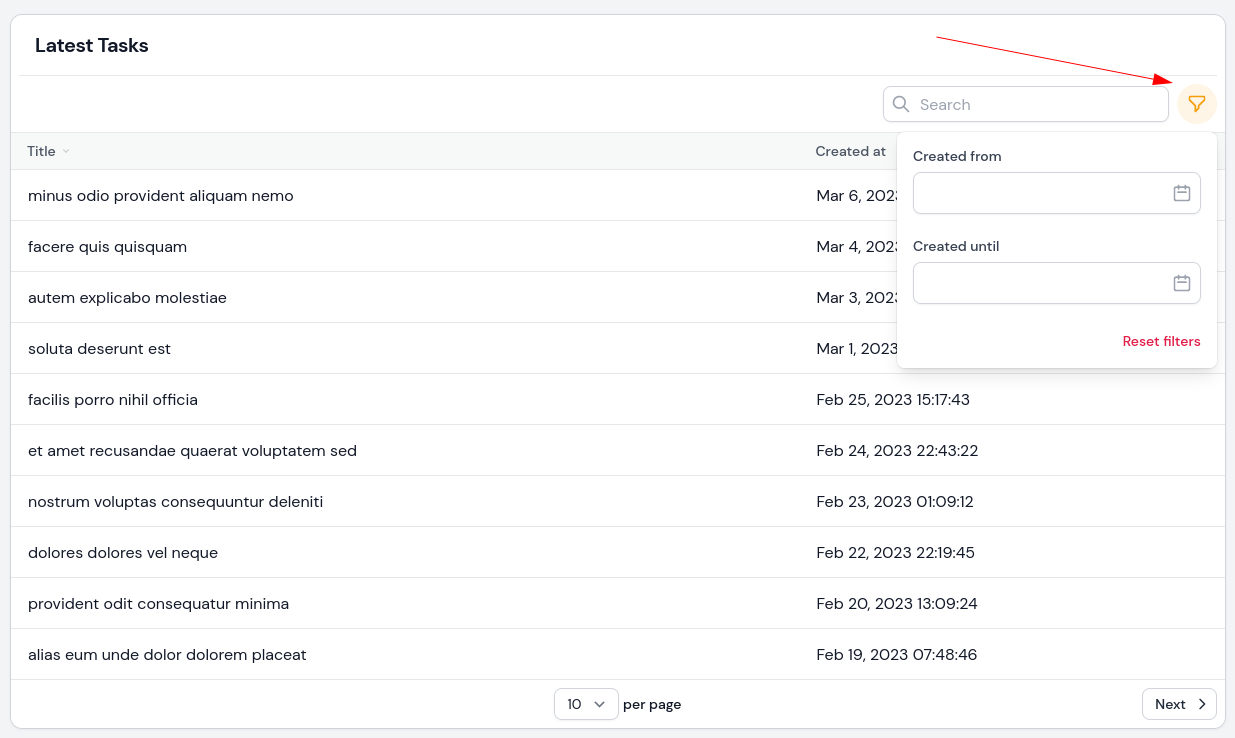
Chart Widget Filter
There are two ways to add a date filter for a Chart widget:
- The longer one is to create a custom widget yourself
- Or, you can use the leandrocfe/filament-apex-charts package, which we will use in this tutorial.
We need to start by installing this package.
composer require leandrocfe/filament-apex-chartsNext, we need to create a chart. For this example, I will choose the line type chart.
php artisan make:filament-apex-charts TasksChartBefore adding filters, let's add real data to it. Filament recommends using the flowframe/laravel-trend package for generating chart data.
composer require flowframe/laravel-trendapp/Filament/Widgets/TasksChart.php:
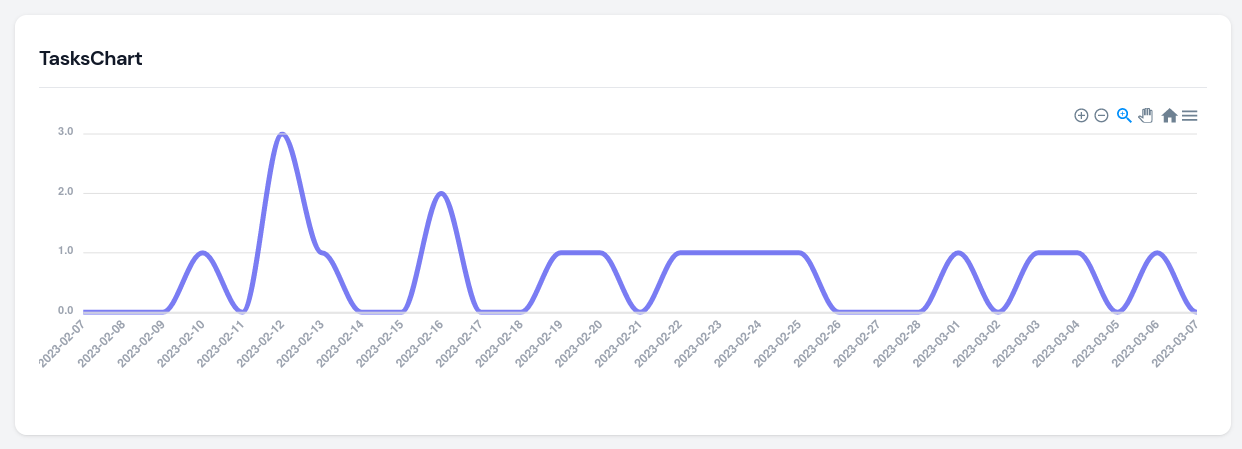
namespace App\Filament\Widgets; use App\Models\Task;use Flowframe\Trend\Trend;use Illuminate\Support\Carbon;use Flowframe\Trend\TrendValue;use Leandrocfe\FilamentApexCharts\Widgets\ApexChartWidget; class TasksChart extends ApexChartWidget{ protected int | string | array $columnSpan = 'full'; protected static string $chartId = 'tasksChart'; protected static ?string $heading = 'TasksChart'; protected function getOptions(): array { $data = Trend::model(Task::class) ->between( start: now()->subMonth(), end: now(), ) ->perDay() ->count(); return [ 'chart' => [ 'type' => 'line', 'height' => 300, ], 'series' => [ [ 'name' => 'TasksChart', 'data' => [7, 4, 6, 10, 14, 7, 5, 9, 10, 15, 13, 18], 'data' => $data->map(fn (TrendValue $value) => $value->aggregate), ], ], 'xaxis' => [ 'categories' => ['Jan', 'Feb', 'Mar', 'Apr', 'May', 'Jun', 'Jul', 'Aug', 'Sep', 'Oct', 'Nov', 'Dec'], 'categories' => $data->map(fn (TrendValue $value) => $value->date), 'labels' => [ 'style' => [ 'colors' => '#9ca3af', 'fontWeight' => 600, ], ], ], 'yaxis' => [ 'labels' => [ 'style' => [ 'colors' => '#9ca3af', 'fontWeight' => 600, ], ], ], 'colors' => ['#6366f1'], 'stroke' => [ 'curve' => 'smooth', ], ]; }}Now you have a tasks chart in your dashboard with real data for a month.
Now, if we want to change the period shown in the chart, we can do it using this package.
First, we need to add the getFormSchema() method where all filters need to be added.
app/Filament/Widgets/TasksChart.php:
use Filament\Forms\Components\DatePicker; class TasksChart extends ApexChartWidget{ // ... protected function getFormSchema(): array { return [ DatePicker::make('date_start') ->default(now()->subMonth()), DatePicker::make('date_end') ->default(now()), ]; }}All that's left is to use those values within the getOptions() method using the $this->filterFormData array. And because we get the date as a string, but the package needs it to be a Carbon value, we need to add this value into the Carbon::parse() method.
app/Filament/Widgets/TasksChart.php:
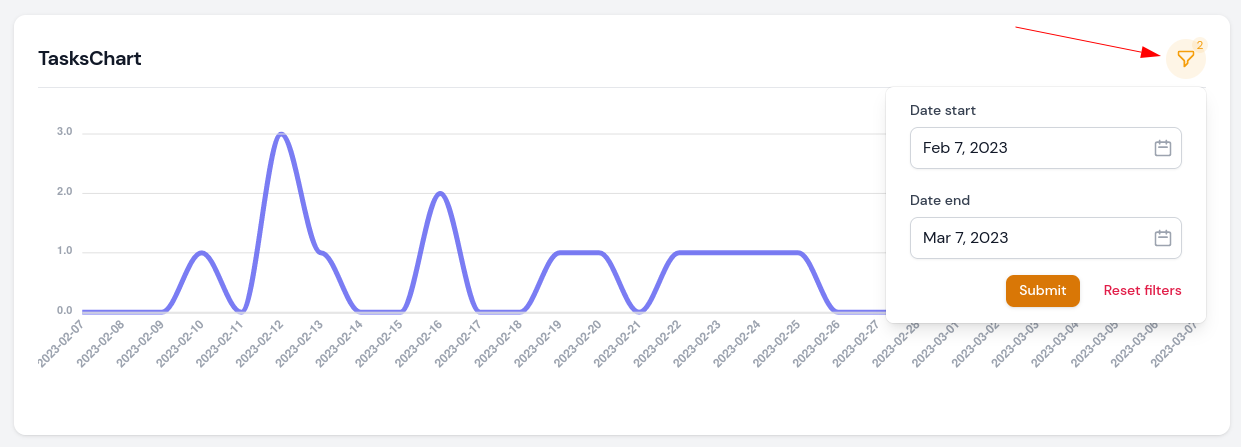
<?php namespace App\Filament\Widgets; use App\Models\Task;use Flowframe\Trend\Trend;use Illuminate\Support\Carbon;use Flowframe\Trend\TrendValue;use Filament\Forms\Components\DatePicker;use Leandrocfe\FilamentApexCharts\Widgets\ApexChartWidget; class TasksChart extends ApexChartWidget{ protected int | string | array $columnSpan = 'full'; protected static string $chartId = 'tasksChart'; protected static ?string $heading = 'TasksChart'; protected function getOptions(): array { $data = Trend::model(Task::class) ->between( start: now()->subMonth(), end: now(), start: Carbon::parse($this->filterFormData['date_start']), end: Carbon::parse($this->filterFormData['date_end']), ) ->perDay() ->count(); return [ 'chart' => [ 'type' => 'line', 'height' => 300, ], 'series' => [ [ 'name' => 'TasksChart', 'data' => $data->map(fn (TrendValue $value) => $value->aggregate), ], ], 'xaxis' => [ 'categories' => $data->map(fn (TrendValue $value) => $value->date), 'labels' => [ 'style' => [ 'colors' => '#9ca3af', 'fontWeight' => 600, ], ], ], 'yaxis' => [ 'labels' => [ 'style' => [ 'colors' => '#9ca3af', 'fontWeight' => 600, ], ], ], 'colors' => ['#6366f1'], 'stroke' => [ 'curve' => 'smooth', ], ]; } protected function getFormSchema(): array { return [ DatePicker::make('date_start') ->default(now()->subMonth()), DatePicker::make('date_end') ->default(now()), ]; }}After all this, you have filter options for the chart widget.
That is it for this tutorial. As you can see, Filament is very flexible as everything under the hood is a Livewire component. Also, browse the Filament plugins list, it may save you many hours.
If you want more Filament examples, you can find more real-life projects on our FilamentExamples.com.
Just applied it in my own project. clear explanation and straight to the point.
Great tutorial! Is possible to set one date filter for all widgets? not separately ?
I don't have the answer right away, but worth exploring in a separate tutorial with v3. Adding to my to-do list.
Would love to see what. We are trying to mimic a dashboard where there's one date range controlling all widgets as well as one date range for each widget to override the master date range
Take a look at this article: https://laraveldaily.com/post/filament-one-filter-for-multiple-widgets-livewire-events
It should do one filter for all tables (without overriding as that is separate)
@Modestas, thanks!