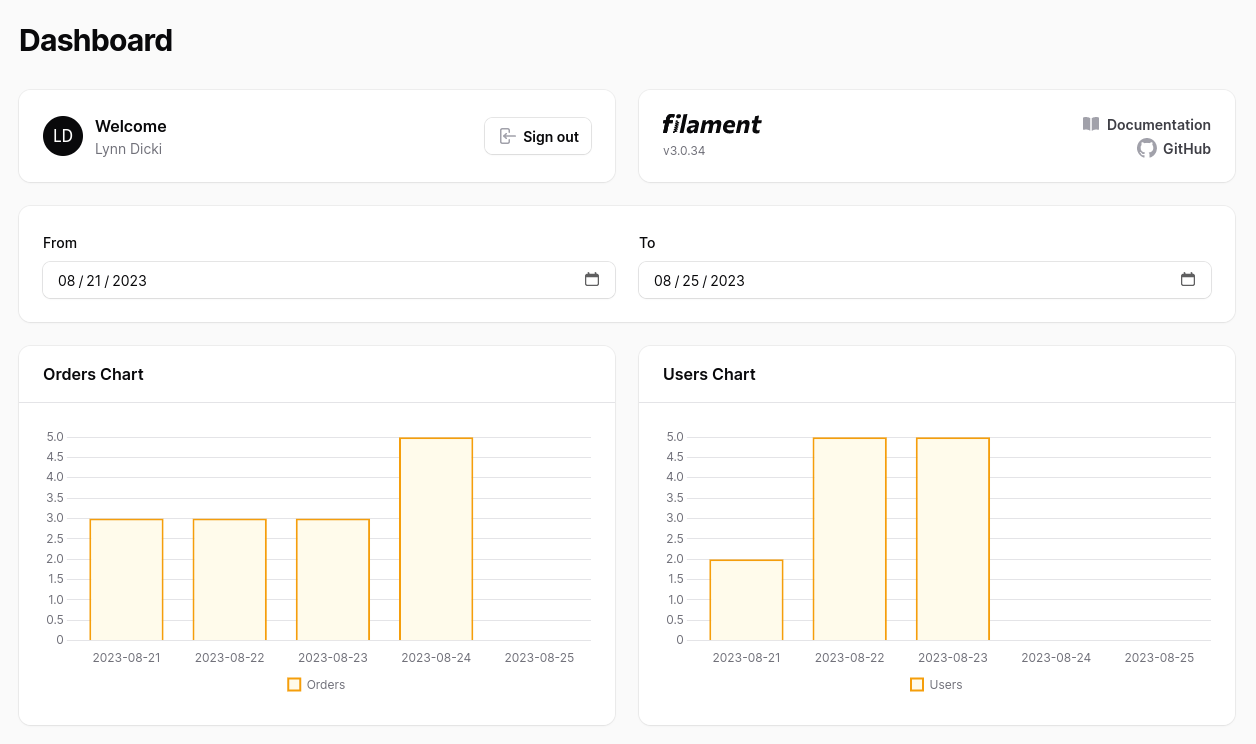
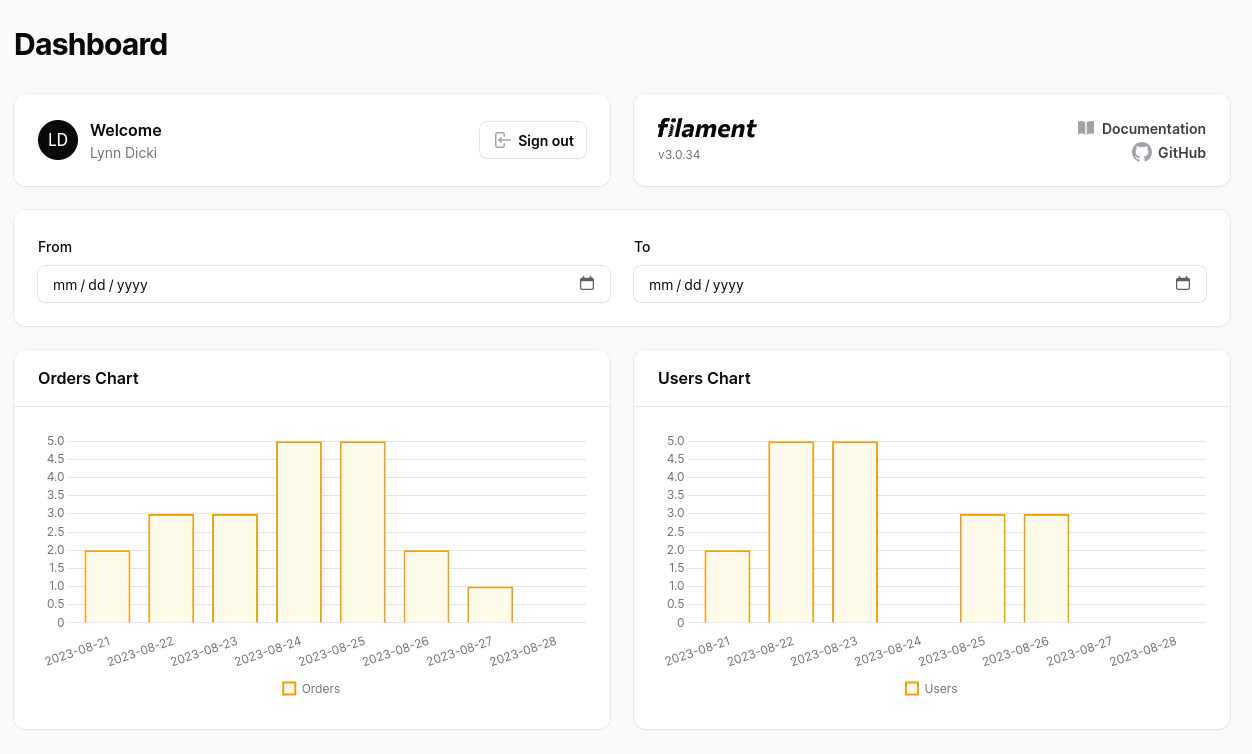
In Filament, adding a filter to dashboard widgets is pretty straightforward. But what if you want to have a filter that would update MULTIPLE widgets at once, similar to Google Analytics? We need to use events and Livewire properties for this. Let's take a look.

Widgets
First, let's create the widgets. We will need three widgets:
- Form with date filters
- Chart with orders
- Chart with Users
php artisan make:filament-widget Filtersphp artisan make:filament-widget OrdersChart --chartphp artisan make:filament-widget UsersChart --chartFor the charts, I will be using the bar type.
Now, let's show date inputs in the Filters widget with Filament Forms. Also, the Filters widget needs to be full width and have the $sort = 1 to be on top.
app/Filament/Widgets/Filters.php:
use Filament\Forms\Form;use Filament\Forms\Components\Grid;use Filament\Forms\Contracts\HasForms;use Filament\Forms\Components\DatePicker;use Filament\Forms\Concerns\InteractsWithForms; class Filters extends Widget implements HasForms{ use InteractsWithForms; protected static string $view = 'filament.widgets.filters'; protected int | string | array $columnSpan = 'full'; protected static ?int $sort = 1; public ?array $data = []; public function form(Form $form): Form { return $form ->statePath('data') ->schema([ Grid::make() ->schema([ DatePicker::make('from'), DatePicker::make('to'), ]), ]); }}In the dashboard, we now have a widget with two date inputs.

For the other two widgets, we will show a chart of two models, User and Order. These charts will show how many new records are created daily.
For passing data to the chart, we will use the package recommended by Filament flowframe/laravel-trend.
composer require flowframe/laravel-trendAnd for the charts.
app/Filament/Widgets/OrdersChart.php:
use App\Models\Order;use Flowframe\Trend\Trend;use Flowframe\Trend\TrendValue;use Filament\Widgets\ChartWidget; class OrdersChart extends ChartWidget{ protected static ?string $heading = 'Orders Chart'; protected static ?int $sort = 2; protected function getData(): array { $data = Trend::model(Order::class) ->between( start: now()->subWeek(), end: now(), ) ->perDay() ->count(); return [ 'datasets' => [ [ 'label' => 'Orders', 'data' => $data->map(fn (TrendValue $value) => $value->aggregate), ], ], 'labels' => $data->map(fn (TrendValue $value) => $value->date), ]; } protected function getType(): string { return 'bar'; }}app/Filament/Widgets/UsersChart.php:
use App\Models\User;use Flowframe\Trend\Trend;use Flowframe\Trend\TrendValue;use Filament\Widgets\ChartWidget; class UsersChart extends ChartWidget{ protected static ?string $heading = 'Users Chart'; protected static ?int $sort = 3; protected function getData(): array { $data = Trend::model(User::class) ->between( start: now()->subWeek(), end: now(), ) ->perDay() ->count(); return [ 'datasets' => [ [ 'label' => 'Users', 'data' => $data->map(fn (TrendValue $value) => $value->aggregate), ], ], 'labels' => $data->map(fn (TrendValue $value) => $value->date), ]; } protected function getType(): string { return 'bar'; }}We also have two charts in the dashboard showing data from the week to now.

Updating Charts
So now, let's update the charts when a filter is selected. To achieve this, we will need to...
Premium Members Only
This advanced tutorial is available exclusively to Laravel Daily Premium members.
Already a member? Login here
Premium membership includes:
Comments & Discussion
protected static string $view = 'filament.widgets.filters'
It shows empty widget.
I'm trying to set a default date to the date component with ->default(now) but the value is not set in the component, any idea? Thx for help
Nice tutorial :) Thx! One question: I get a 500 error, Filament\Widgets\ChartWidget::$dataChecksum
Error: Typed property Filament\Widgets\ChartWidget::$dataChecksum must not be accessed before initialization
I didn't found anything about this kind of error... any thought?
This error happens when you use the variable before it has any value. If you could, please add additional code here.
But few things to look out:
- Custom variable has to have a default value set (null is also a value!)
- You can't use a variable that has no value as it will not be initialized
More another greate tutorial, but i've a error: Cannot assign Carbon\Carbon to property Flowframe\Trend\Trend::$start of type Illuminate\Support\Carbon
https://flareapp.io/share/Lm8Q0opP
Can you help me?
This is interesting. Is there a straight forward way to implement a resource form in a widget? Let's say we have a Customer and Order models, where orders belong to customer. We can go to standard CRUD for any of the resources, but could we implement a mini version of that in a widget? So we can quickly select a Customer and fill out minimum required fields for Order. I think it would be useful when on mobile phone for example, and when you gat back to a PC fill the rest of the forms with standard full model CRUD.
Any idea how to do this same type thing using the ApexCharts plugin for filament? It's mostly working based on your tutorial, but I can't get the chart to re-render even after using ->reactive() and -afterStateUpdated()
Good tutorial, very helpful. Thanks!
But for some reason I couldn't get this to work with Filament\Widgets\StatsOverviewWidget .. Maybe I'm using a newer version Filament.
Anyway, the official documentation also contains examples of how to implement similar functional https://filamentphp.com/docs/3.x/panels/dashboard
And it’s funny that I first found the solution on laraveldaily.com and not on the official website))

thank you for this great tutorial!