
One of the most popular simple JavaScript libraries for charts is Chart.js. Let's see how to use it in Laravel, with three practical examples: bar, line, and pie charts.
In this tutorial, we will create three charts based on "users" DB table:
- Bar chart of registered users per day, in the last 30 days
- Same chart just in "line" mode instead of "bar"
- We will add a
birth_datefield and build a "pie" chart of birthdays per season: winter/spring/summer/fall.
But before building those charts, we need to have some kind of visual layout, and the data in the DB to show on the charts, right?
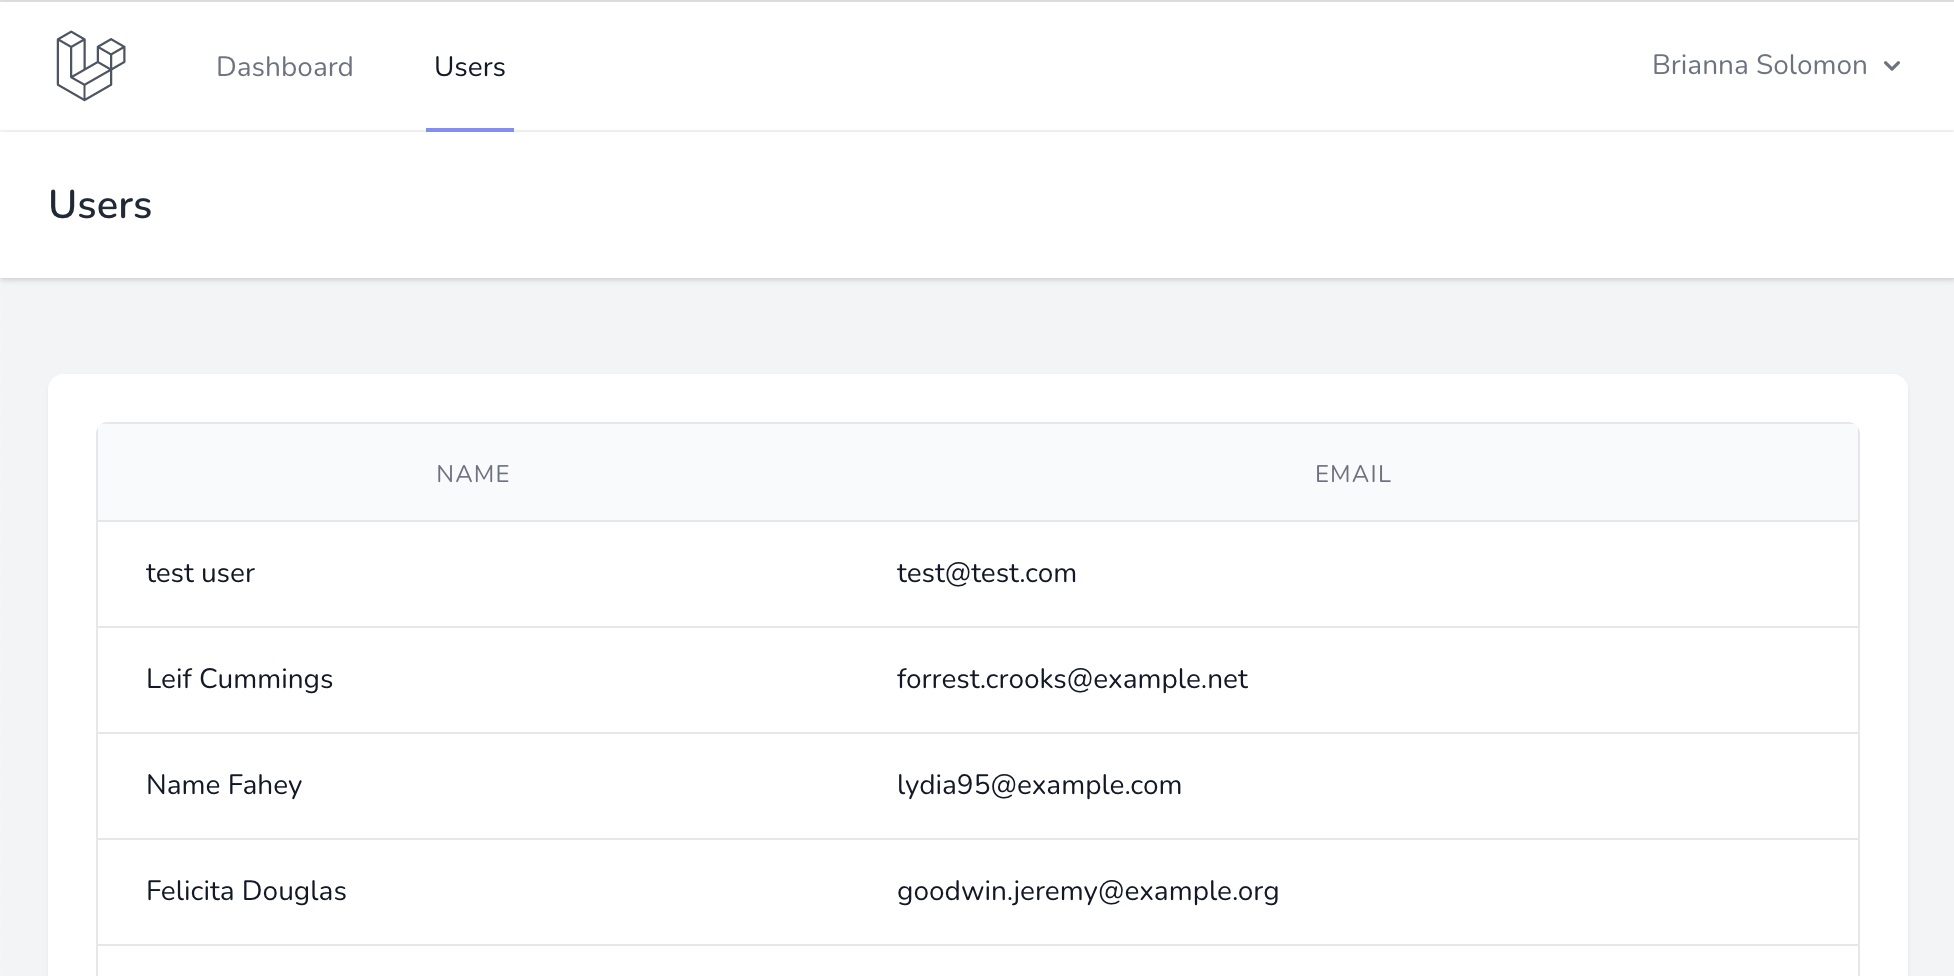
Prepare Laravel Application
For this tutorial, we will use our own Laravel Breeze Skeleton that gives us a simple design.
Next, the database schema. We'll add a birth_date field...
Premium Members Only
This advanced tutorial is available exclusively to Laravel Daily Premium members.
Already a member? Login here
Premium membership includes:
Hello,
Can you please help how to use where_raw in your Laravel Daily Chart? This option can be used for all type of charts?
Hello, I'm not sure I understood your comment here. I'll try, but correct me if I'm wrong:
Using the
whereRaw()is the same as selectRaw() or any other Raw function - you just need to write a mysql query manually. Keep in mind that this can be dangerous!As for types of charts this works on - yes, it can be used on all charts. This is to retrieve the data from database and has nothing to do with the chart itself