In Laravel and Eloquent, to avoid N+1 Query problems or to find slow SQL queries, you may use automatic tools. In this short tutorial, I will show you a few of them.
Laravel Debugbar
This is a package to integrate PHP Debug Bar with Laravel. I think this package is a must-have when developing applications. To use this package you just need to install it via the composer
composer require barryvdh/laravel-debugbar --devThe Debugbar will be enabled when APP_DEBUG is true.
Note: Use the DebugBar only in development. It can slow the application down (because it has to gather data). So when experiencing slowness, try disabling some of the collectors.
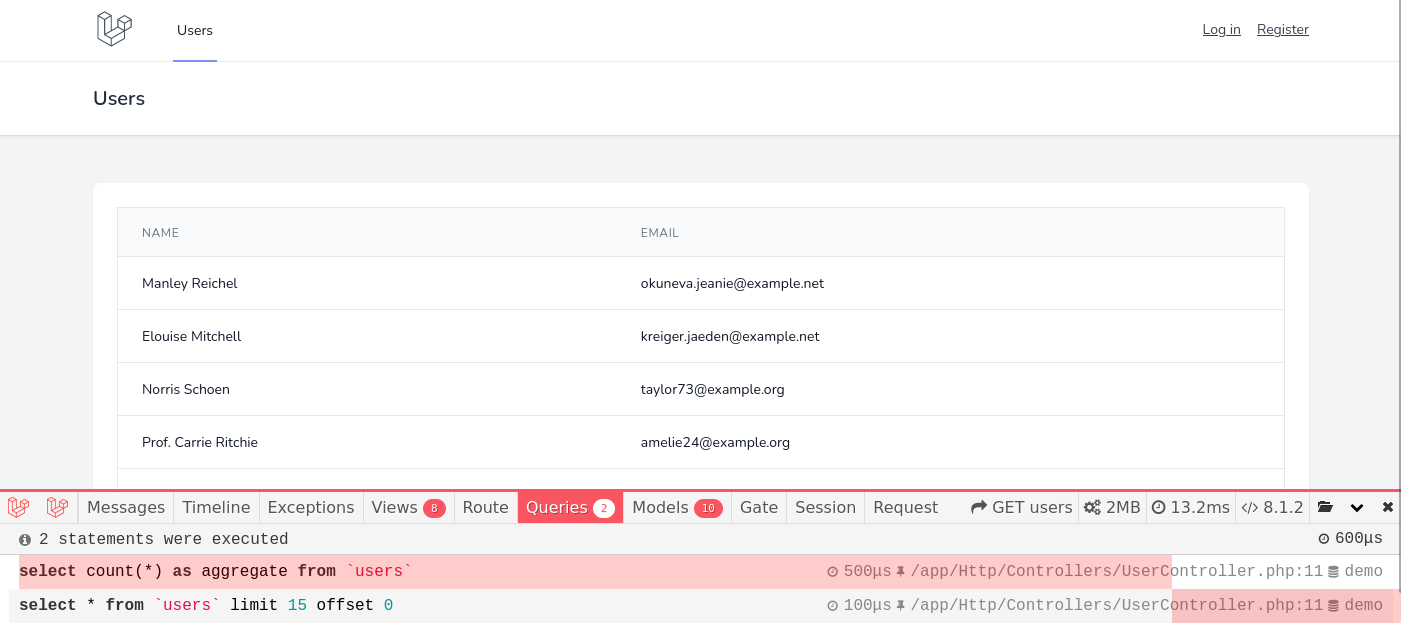
After visiting your project in the browser, at the bottom you will see a bar.

If you will click the Queries tab, you will all DB queries that are executed on this page.
Official documentation can be found here.
Laravel Telescope
Telescope provides insight into the requests coming into your application, exceptions, log entries, database queries, queued jobs, mail, notifications, cache operations, scheduled tasks, variable dumps, and more. Telescope is very useful when you are building API applications when you don't have visual pages. To use this package first you need to install it via composer:
composer require laravel/telescopeAfter installing, publish its assets and run the migrate command.
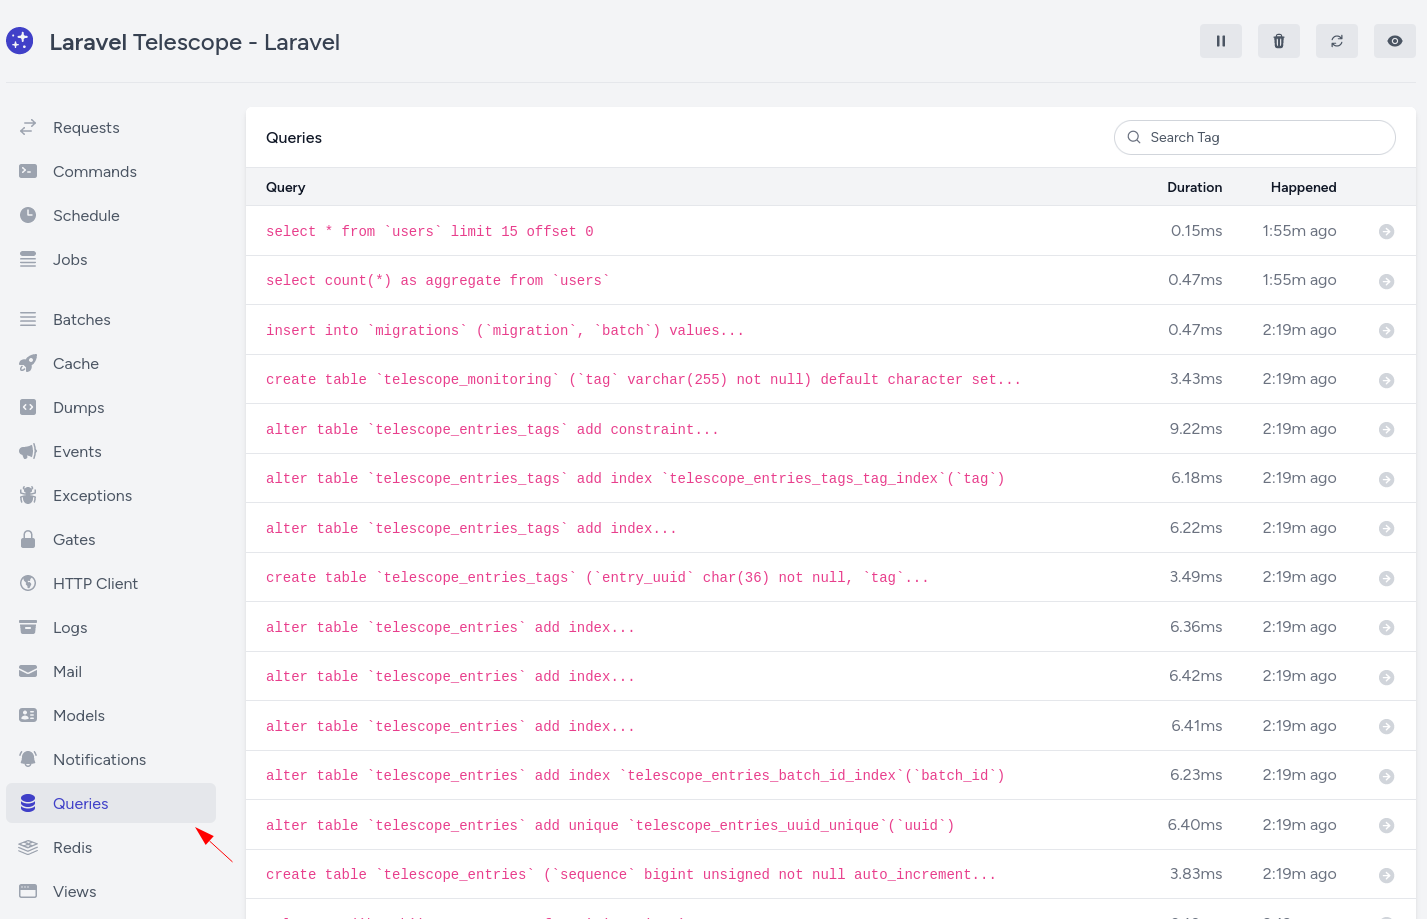
php artisan telescope:installphp artisan migrateAfter visiting any page where to make DB queries, go to the /telescope page. From there go to the Queries page where you will all DB queries even including migrations.
Official documentation can be found here.
Clockwork
Clockwork is a development tool for PHP available right in your browser. Clockwork gives you an insight into your application runtime - including request data, performance metrics, log entries, database queries, cache queries, redis commands, dispatched events, queued jobs, rendered views, and more - for HTTP requests, commands, queue jobs, and tests. Install this package via composer:
composer require itsgoingd/clockworkTo enable more features like commands or queue jobs profiling, publish the configuration file via the vendor:publish Artisan command.
To view data you have a few options:
- Using the web interface, go to yourproject.com/clockwork
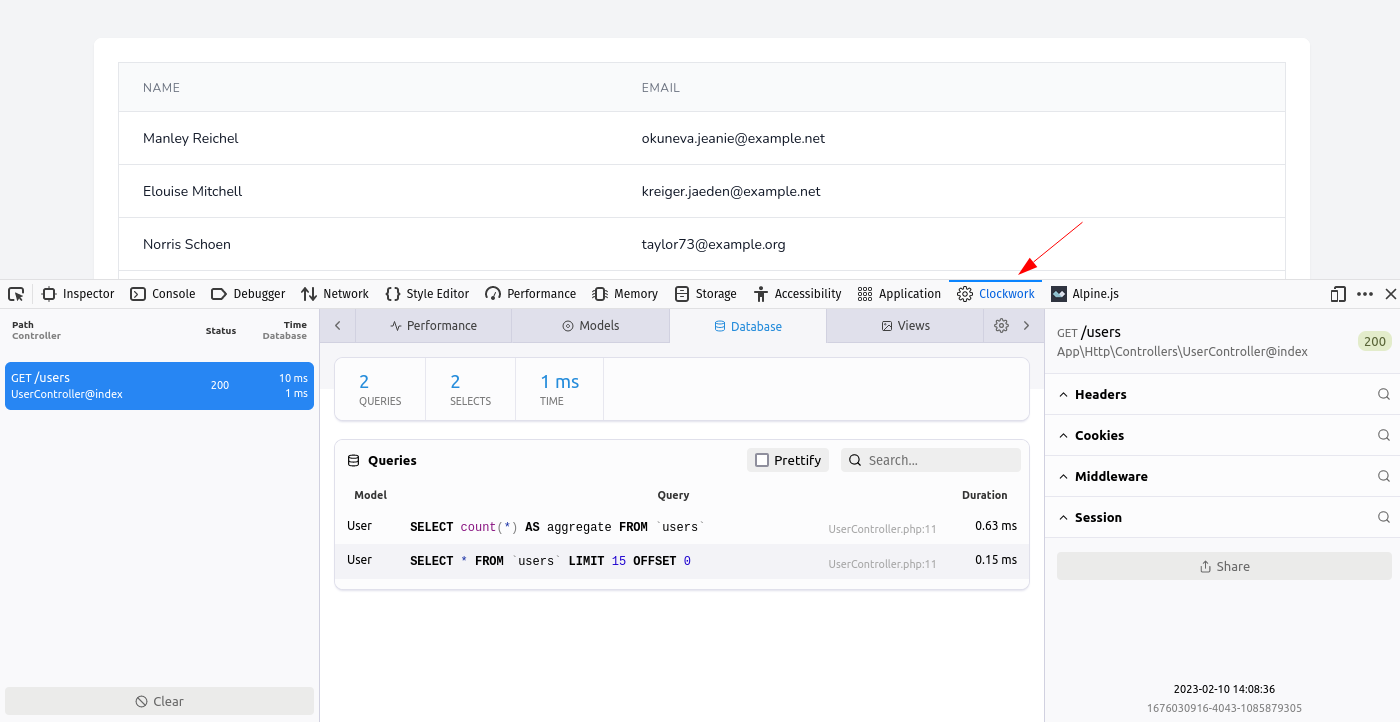
Select the page which you want to check, and in the database tab, you will see queries.

- With browser extension using Chrome or Firefox browsers.
This way you have the web interface, but on the same page and don't need to navigate to different pages just to view queries. It's then the same as Laravel Debugbar.
- By adding a toolbar. For this, you need to install a tiny javascript library.
<script src="https://cdn.jsdelivr.net/gh/underground-works/clockwork-browser@1/dist/toolbar.js"></script>This will show kinda similar bar to Laravel Debugbar, but to view the exact queries, you need to press the Show details button which will redirect to the web interface.

Official documentation can be found here.
Spatie Laravel Ray
Ray is not a free application, but it offers a free trial version. Ray is a beautiful, lightweight desktop app that helps you debug your app. In addition to debugging locally, you can also connect to a server. To use this application first you need to download. Then you need to install its free package via composer:
composer require spatie/laravel-ray --devNow you can use ray(), dd(), and dump() in any file and it will show results in the application.
By adding one line in your controller method, after visiting that page Ray will show all executed queries.
class UserController extends Controller{ public function index() { ray()->showQueries(); $users = User::paginate(); return view('users.index', compact('users')); }}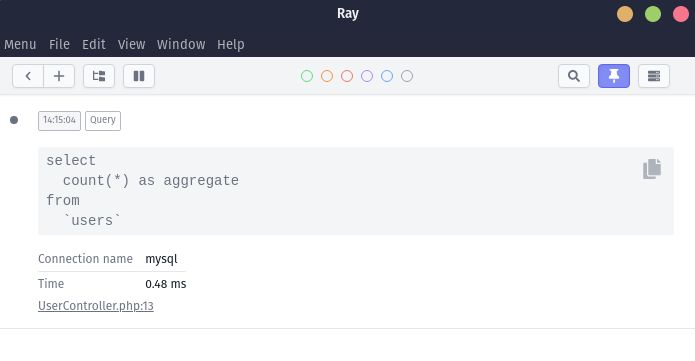
Official documentation can be found here.
toSql() Method
If for some reason you won't use any tools mentioned above, you can dump the query using the native toSql() Laravel method.
For example this query:
$users = User::query() ->where('created_at', '<', now()->subYear()) ->orderBy('email', 'asc') ->limit(5) ->toSql();dd($users);Will dump output like so:
"select * from `users` where `created_at` < ? order by `email` asc limit 5" // app/Http/Controllers/UserController.php:16toRawSql()
Since Laravel 10.15, there is a method called toRawSql(). This method is similar to the above toSql() method, which dumps the query but also embeds bindings. Instead of question marks, you will see values.
$users = User::query() ->where('created_at', '<', now()->subYear()) ->orderBy('email', 'asc') ->limit(5) ->toRawSql();dd($users);Will dump output like so:
"select * from "users" where "created_at" < '2023-07-13 10:50:53' order by "email" asc limit 5" // app/Http/Controllers/UserController.php:16There is also dumpRawSql() and ddRawSql() methods. The pull request for these methods can be found here.
Laravel Pulse
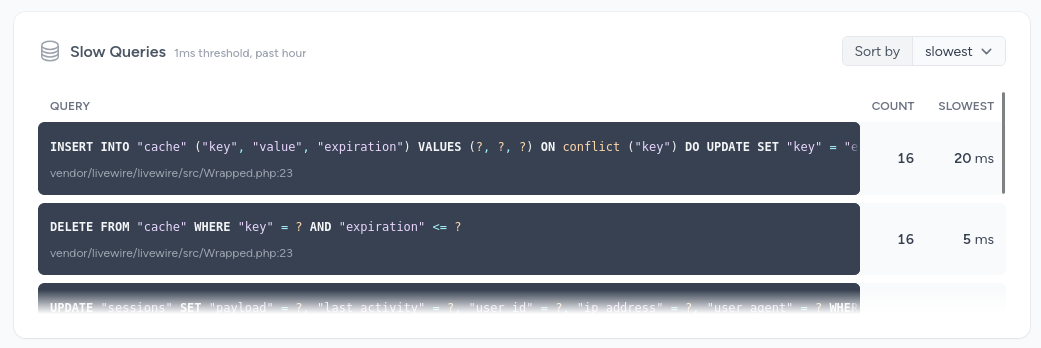
With the Laravel Pulse package, you can catch slow queries and see them in the card. By default, the threshold for queries is 1,000ms. This setting can be changed by setting the PULSE_SLOW_QUERIES_THRESHOLD environment variable.
MySQL Explain
With the help of a package tpetry/laravel-mysql-explain, you can get a link to a mysqlexplain.com. You will see the explanation of the query on the webpage, and now this tool generates visual flows.
As the name says, this tool only works with MySQL.
// URL to EXPLAIN will be printed to screen// Example URL will be https://mysqlexplain.com/explain/01j2gcrbsjet9r8rav114vgfsy$users = User::query() ->where('created_at', '<', now()->subYear()) ->orderBy('email', 'asc') ->limit(5) ->dumpVisualExplain() ->get();
You may be interested in our PREMIUM course Better Eloquent Performance

Hello,
there is a typo in the code of the MySQL visual explain, you forgot the parenthesis. It's '->dumpVisualExplain()'.
cheers.
Wow somehow I noticed the comment only now. Fixed, thanks!