
In this lesson, let's change our dashboard to something more interesting than static placeholders.
Typically, we have charts and numbers on the dashboard of such projects. So, we can calculate something like these:
- Tasks completed vs in progress
- Tasks due today
- Tasks created this week, grouped by day
Let's show them all on the dashboard.
Change Factory and Re-Seed Data
To have some data to show, we need to randomize a few things and seed more tasks.
database/factories/TaskFactory.php:
return [ 'name' => fake()->name(), 'is_completed' => fake()->boolean(), 'due_date' => fake()->dateTimeBetween('now', '+1 month'), 'created_at' => fake()->dateTimeBetween(now()->startOfWeek(), now()->endOfWeek()), ];database/seeders/DatabaseSeeder.php:
Task::factory()->count(10)->create(); Task::factory()->count(100)->create(); And now, let's freshen and re-seed the whole database (yes, we lose the data, but this is a demo project, so I'm okay with that).
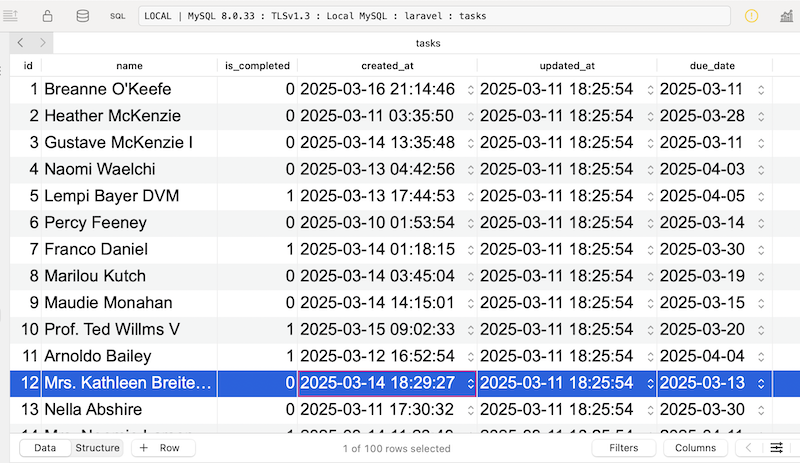
php artisan migrate:fresh --seedGreat, we have 100 random tasks in the database:
Dashboard Controller with Data
By default, we load the dashboard directly from the Routes file.
routes/web.php:
Route::get('dashboard', function () { return Inertia::render('dashboard');})->name('dashboard');Now, let's add more logic. So, we need a Controller...
The code works in that it runs, but it doesn't pass Typescript checking meaning that
datawill be higlighted as a Typescript error.To correct this, define 2 new itefaces at the top under your imports:
Then apply the correct types to
completedVsPendingTaskChartandtasksCreatedByDay:Tried to delete a task and got the following Error: SQLSTATE[23000]: Integrity constraint violation: 19 FOREIGN KEY constraint failed (Connection: sqlite, SQL: delete from "tasks" where "id" = 1)
Not sure where to go to fix this; can you help?
P.S. The Category Delete works fine no Errors.
I thank I know what Is happening; there is a Category assigned to it. We need to do a unassign of the category first right?
I've just finished this wonderful course, thanks to the LaravelDaily team. I've never worked with React before (only Vue), but I see quite a few similarities. The same as until now I start using Typescript (I still need to study several concepts, of course).
I found an issue that can be easily fixed in the bar chart, only the first day of the week is being graphed and this is because the
datais wrapped in an additional array inDashboardController.php,getTasksCreatedByDay()method.It should be
Hi, thank you for the kind words and for telling us about the issue! I have updated the lesson to fix this issue :)
Thank you for this wonderful course.